Statistics
The API Gateway begins monitoring and collecting data for reporting and analytics when the Developer applications are launched and starts accessing APIs. This statistics data provides real-time streaming analytical insights.
Analyzing these statistics can provide significant information about API popularity and usage trends. Understanding how APIs are used today and forecasting future trends and other API-related data and traffic flow enables you to make crucial business choices that increase API profitability.
Understanding statistical data allows us to gather information about API usage, analyzing traffic levels, calculating revenue contributions, identifying high-traffic APIs, and assessing downtime issues. This analysis is critical for optimizing performance and improving the user experience.
Gateway Response and Backend Response Time
Consider a scenario where a user sends a request to the gateway at time T1. The gateway forwards the request to the backend at time T2. The backend processes the request and sends it back to the gateway at time T3, and the gateway then delivers it to the user at time T4.
Thus, the Total Response Time to the user is T4 - T1. The Backend Response Time is T3 - T2, and the Gateway Response Time is the Total Response Time minus the Backend Response Time, calculated as (T4 - T1) - (T3 - T2).
Statistics Filters
The available statistics filters include Throughput, Latency, Error Rate, Top Selling, Maximum Revenue, Subscription By Version, Response Time, Top Developers, API Timeout, and Developers Usage. These filters allow you to analyze various aspects of API performance, usage, and developer activity.
These filters allow users to analyze various aspects of API performance and usage, providing insights into how efficiently and effectively APIs are operating.
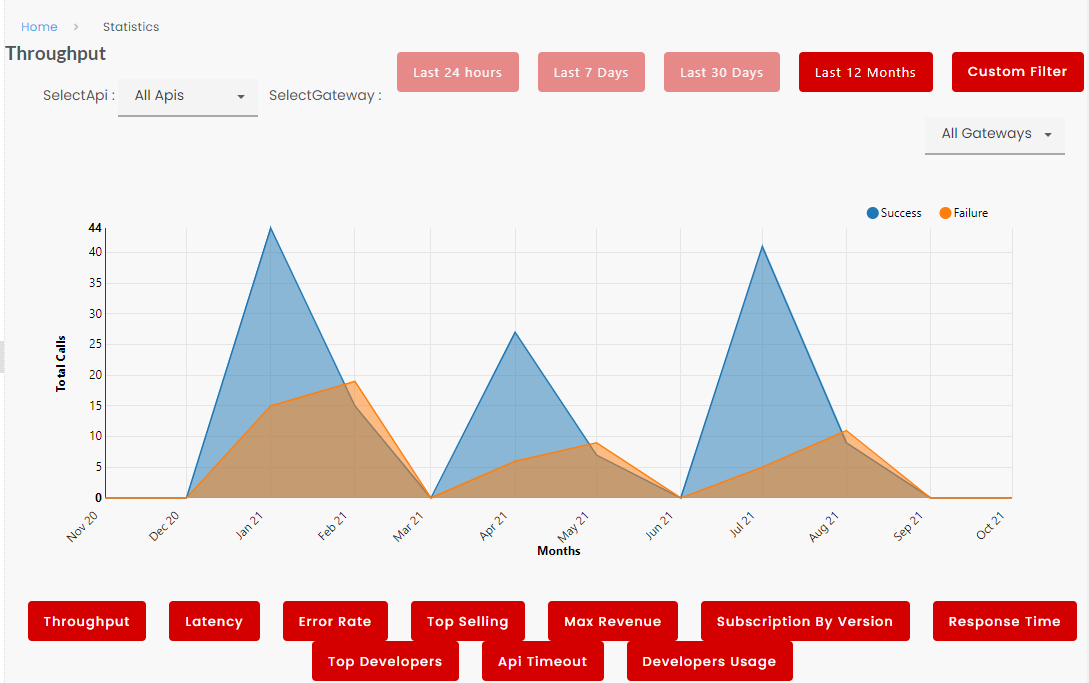
Throughput
Throughput measures the rate at which API requests are processed, indicating the number of requests handled per unit of time.
-
Available time filters include:
- Last 24 Hours
- Last 7 Days
- Last 30 Days
- Last 12 Months
- Custom Filter: Users input a start and end date to view specific results.
-
API selection options include:
- Specific API
- All APIs
-
Gateway selection options include:
- Specific Gateway
- All Gateways

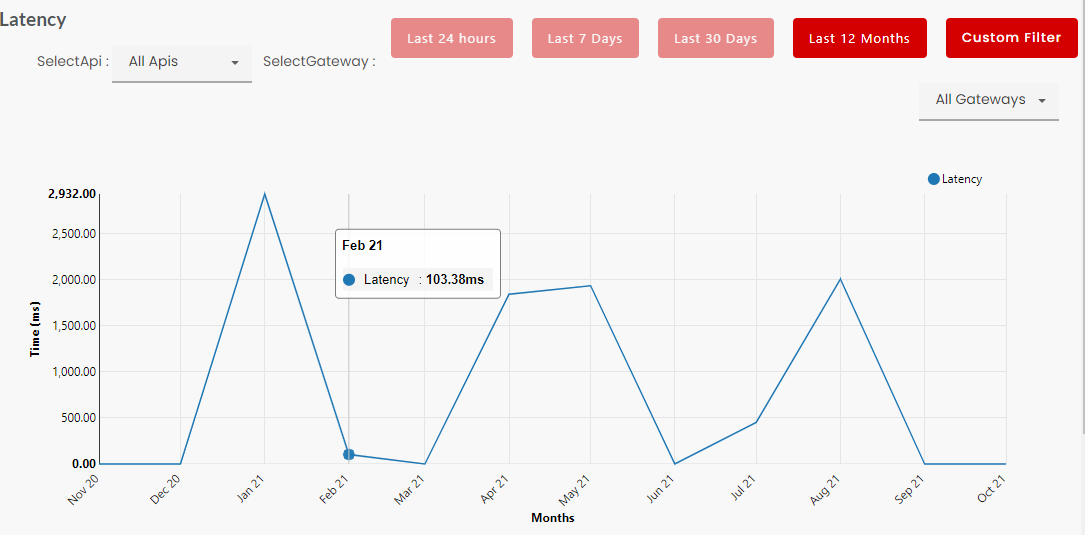
Latency
Latency is the time it takes for an API request to be processed and returned. It calculates the time between submitting a request and receiving a response.
-
Available time filters include:
- Last 24 Hours
- Last 7 Days
- Last 30 Days
- Last 12 Months
- Custom Filter: Users input a start and end date to view specific results.
-
API selection options include:
- Specific API
- All APIs
-
Gateway selection options include:
- Specific Gateway
- All Gateways
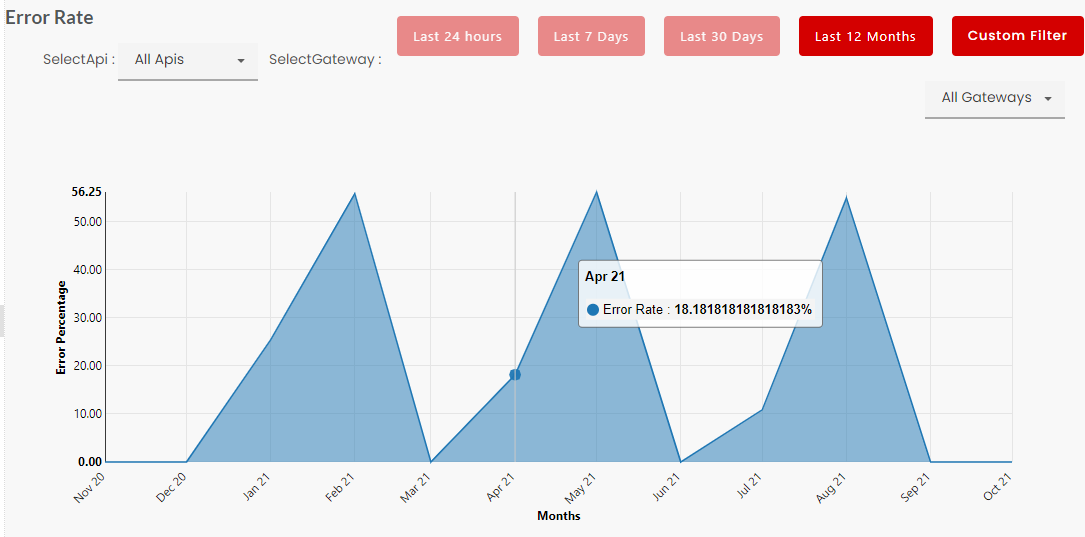
Error Rate
It displays the rate at which failure messages occur relative to the total number of messages processed per unit of time.
-
Available time filters include:
- Last 24 Hours
- Last 7 Days
- Last 30 Days
- Last 12 Months
- Custom Filter: Users input a start and end date to view specific results.
-
API selection options include:
- Specific API
- All APIs
-
Gateway selection options include:
- Specific Gateway
- All Gateways
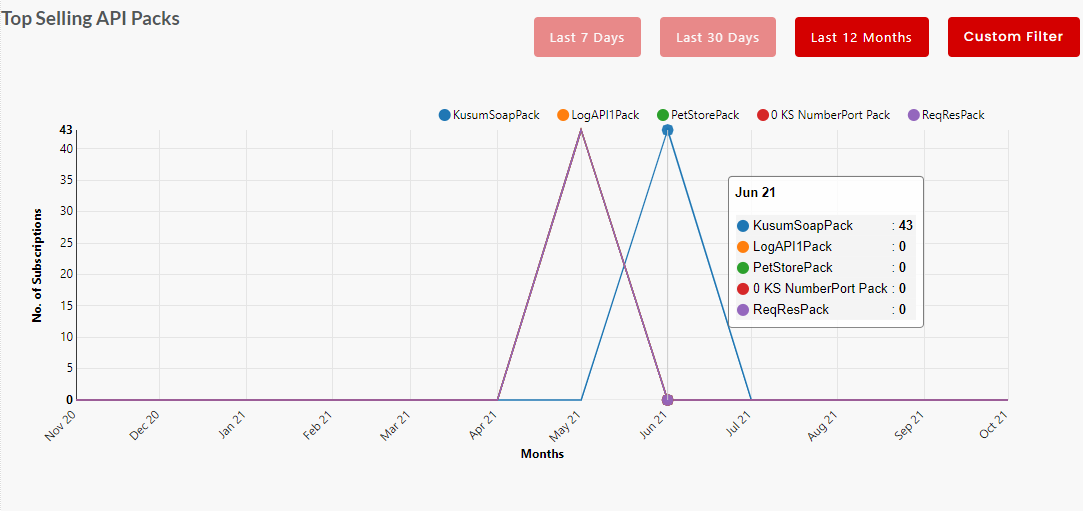
Top Selling
It displays the five most subscribed API Packs per unit of time.
-
Available time filters include:
- Last 7 Days
- Last 30 Days
- Last 12 Months
- Custom Filter: Users input a start and end date to view specific results.
-
API selection options include:
- Specific API
- All APIs
-
Gateway selection options include:
- Specific Gateway
- All Gateways
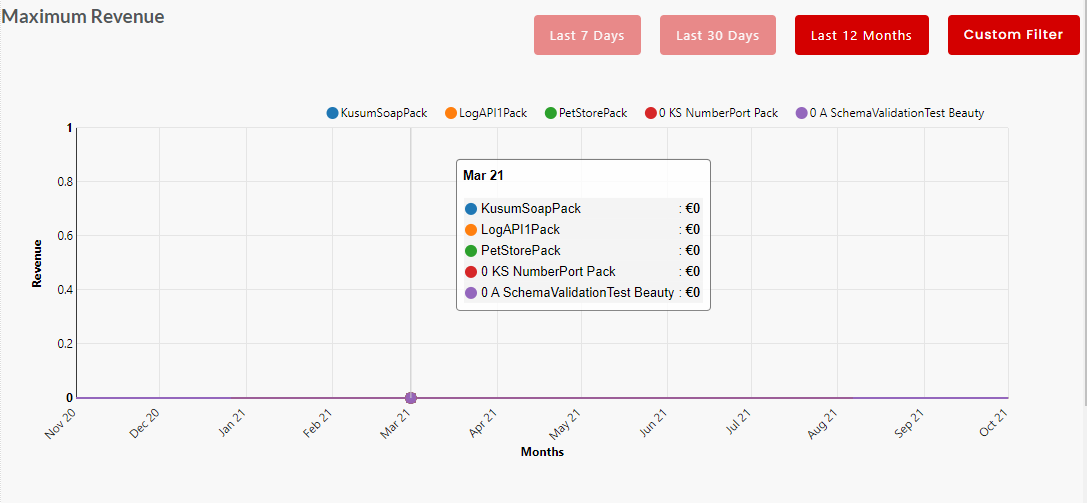
Maximum Revenue
It displays the API packs that generated the highest revenue per unit of time.
-
Available time filters include:
- Last 7 Days
- Last 30 Days
- Last 12 Months
- Custom Filter: Users input a start and end date to view specific results.
-
API selection options include:
- Specific API
- All APIs
-
Gateway selection options include:
- Specific Gateway
- All Gateways
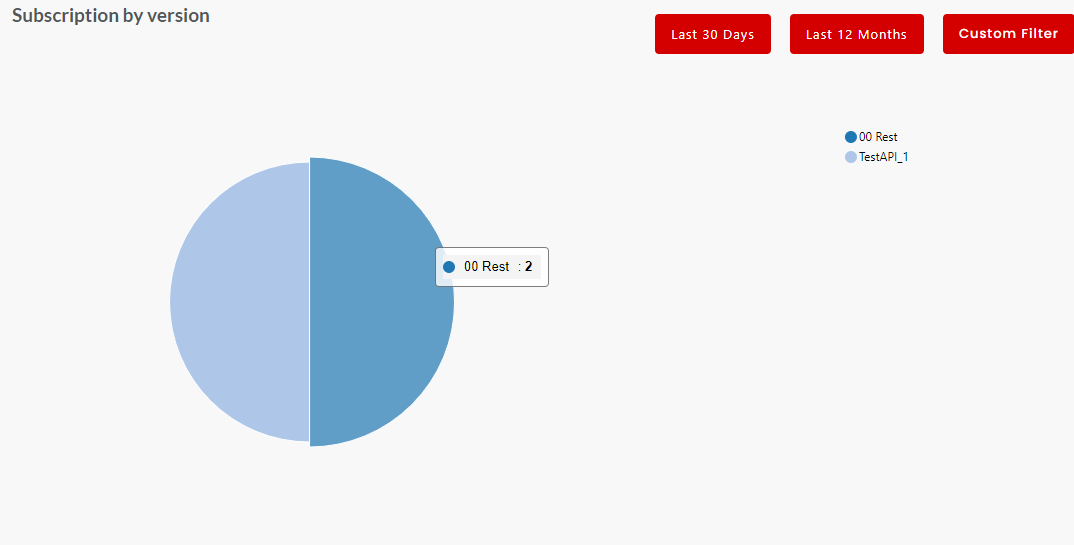
Subscription By Version
It displays the five most subscribed APIs version per unit of time.
-
Available time filters include:
- Last 30 Days
- Last 12 Months
- Custom Filter: Users input a start and end date to view specific results.
-
API selection options include:
- Specific API
- All APIs
-
Gateway selection options include:
- Specific Gateway
- All Gateways
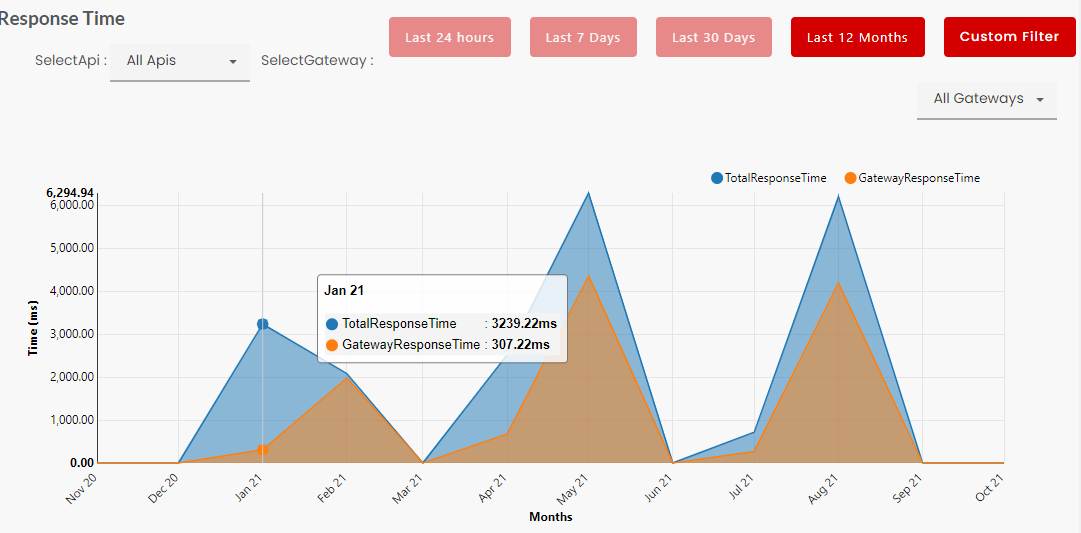
Response Time
It displays the Average response time the APIs receive at various stages of the call per unit of time.
-
Available time filters include:
- Last 24 Hours
- Last 7 Days
- Last 30 Days
- Last 12 Months
- Custom Filter: Users input a start and end date to view specific results.
-
API selection options include:
- Specific API
- All APIs
-
Gateway selection options include:
- Specific Gateway
- All Gateways
Top Developers
It displays the top developers based on their total API consumption per unit of time.
-
Available time filters include:
- Last 30 Days
- Last 12 Months
- Custom Filter: Users input a start and end date to view specific results.
-
API selection options include:
- Specific API
- All APIs
-
Gateway selection options include:
- Specific Gateway
- All Gateways

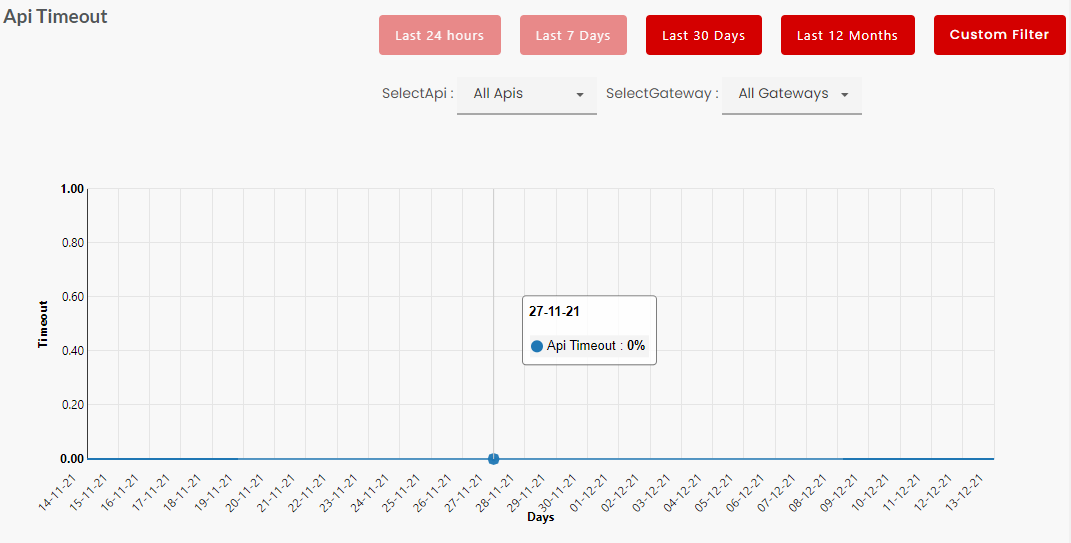
API Timeout
It shows how many times an API failed to respond within a given time.
-
Available time filters include:
- Last 24 Hours
- Last 7 Days
- Last 30 Days
- Last 12 Months
- Custom Filter: Users input a start and end date to view specific results.
-
API selection options include:
- Specific API
- All APIs
-
Gateway selection options include:
- Specific Gateway
- All Gateways
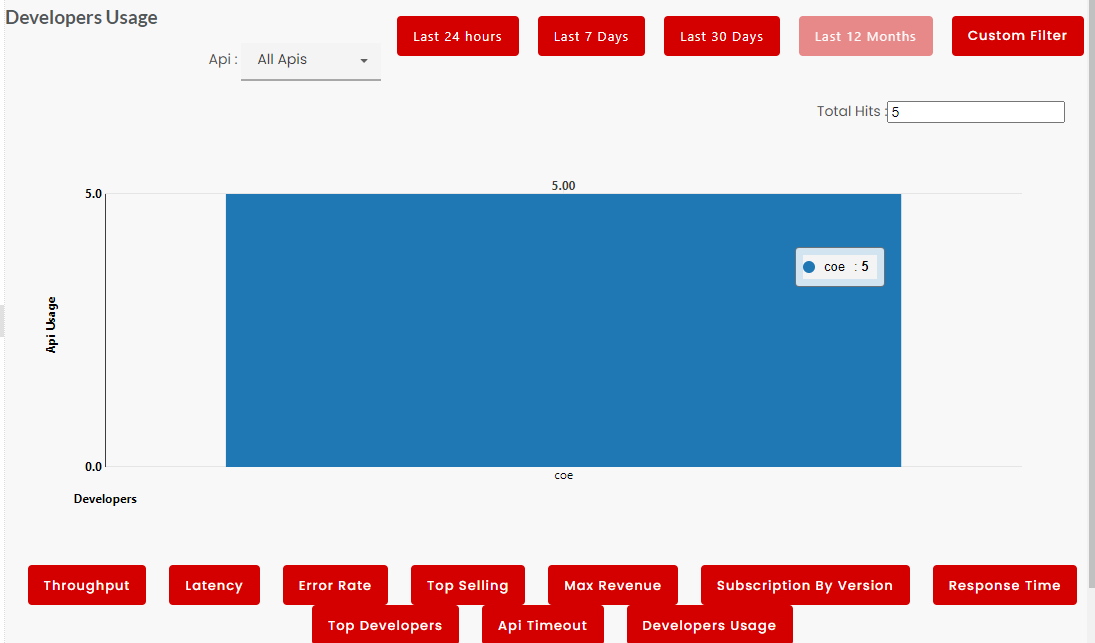
Developers Usage
It displays the API Usage for top developer per unit of time.
-
Available time filters include:
- Last 24 Hours
- Last 7 Days
- Last 30 Days
- Last 12 Months
- Custom Filter: Users input a start and end date to view specific results.
-
API selection options include:
- Specific API
- All APIs
-
Gateway selection options include:
- Specific Gateway
- All Gateways