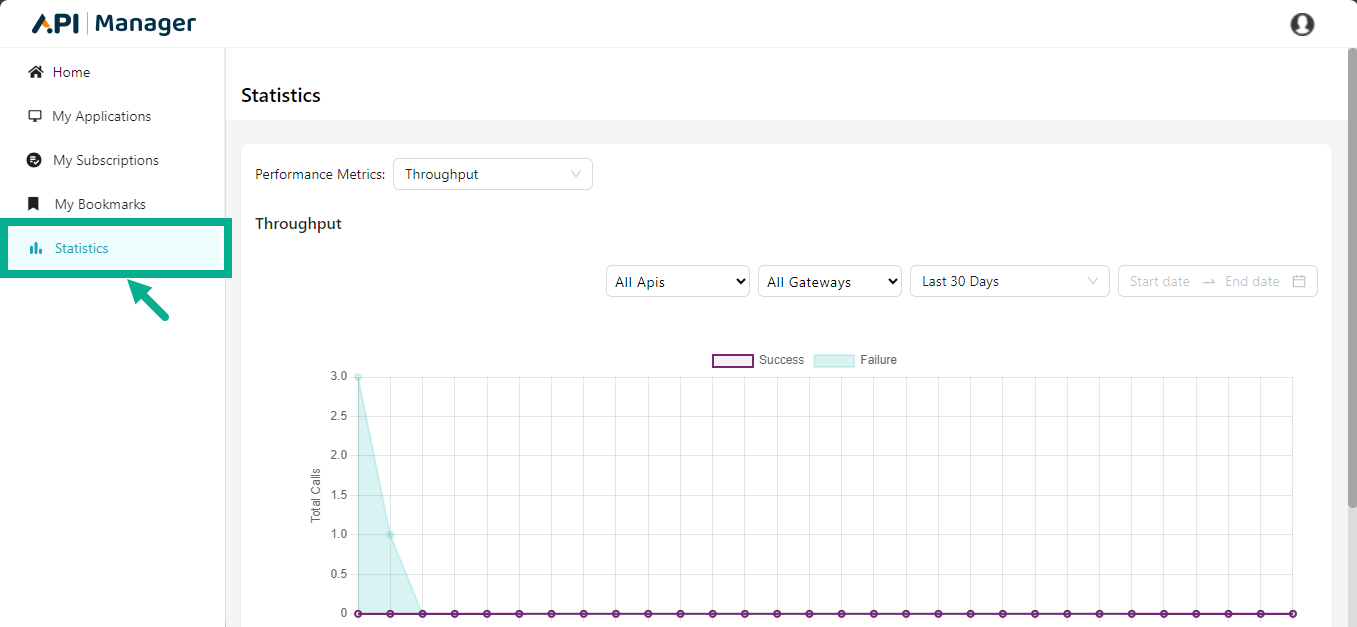
Statistics
Once the Developer Portal go live and start using APIs, the API Gateway starts monitoring and collecting data for reporting and analytics. Statistics also provides real-time streaming analytical data.
Statistical analysis may give significant insights into the popularity and use of APIs. Information on how APIs will be used in the future, as well as other API-related data and traffic flow, allows you to make critical business decisions that contribute to API profitability.
Understanding statistical data allows us to gather information about API usage, analyzing traffic levels, calculating revenue contributions, identifying high-traffic APIs, and assessing downtime issues. This analysis is critical for optimizing performance and improving the user experience.
Gateway Response and Backend Response Time
Consider a scenario where a user sends a request to the gateway at time T1. The gateway forwards the request to the backend at time T2. The backend processes the request and sends it back to the gateway at time T3, and the gateway then delivers it to the user at time T4.
Thus, the Total Response Time to the user is T4 - T1. The Backend Response Time is T3 - T2, and the Gateway Response Time is the Total Response Time minus the Backend Response Time, calculated as (T4 - T1) - (T3 - T2).
Statistics Filters
The available statistics filters include Throughput, Latency, Most Used APIs, Quota Consumption, API Errors, and API Timeouts.
These filters allow users to analyze various aspects of API performance and usage, providing insights into how efficiently and effectively APIs are operating.
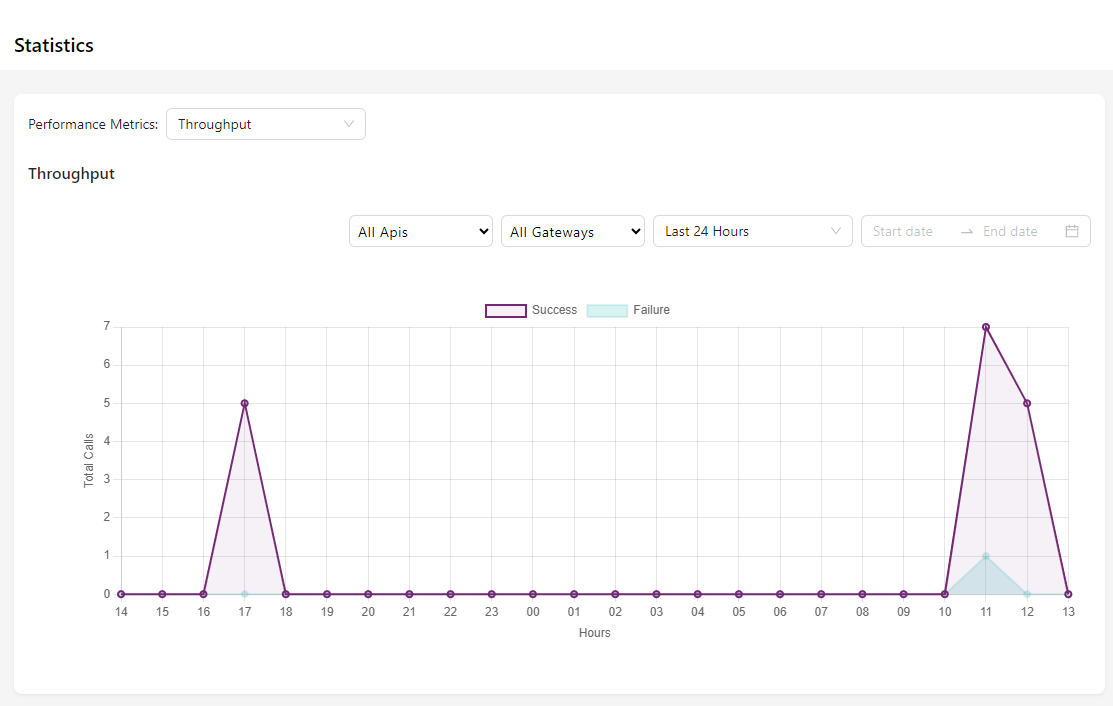
Throughput
Throughput measures the rate at which API requests are processed, indicating the number of requests handled per unit of time.
-
Available time filters include:
- Last 24 Hours
- Last 7 Days
- Last 30 Days
- Last 12 Months
- Custom Filter: Users input a start and end date to view specific results.
-
API selection options include:
- Specific API
- All APIs
-
Gateway selection options include:
- Specific Gateway
- All Gateways
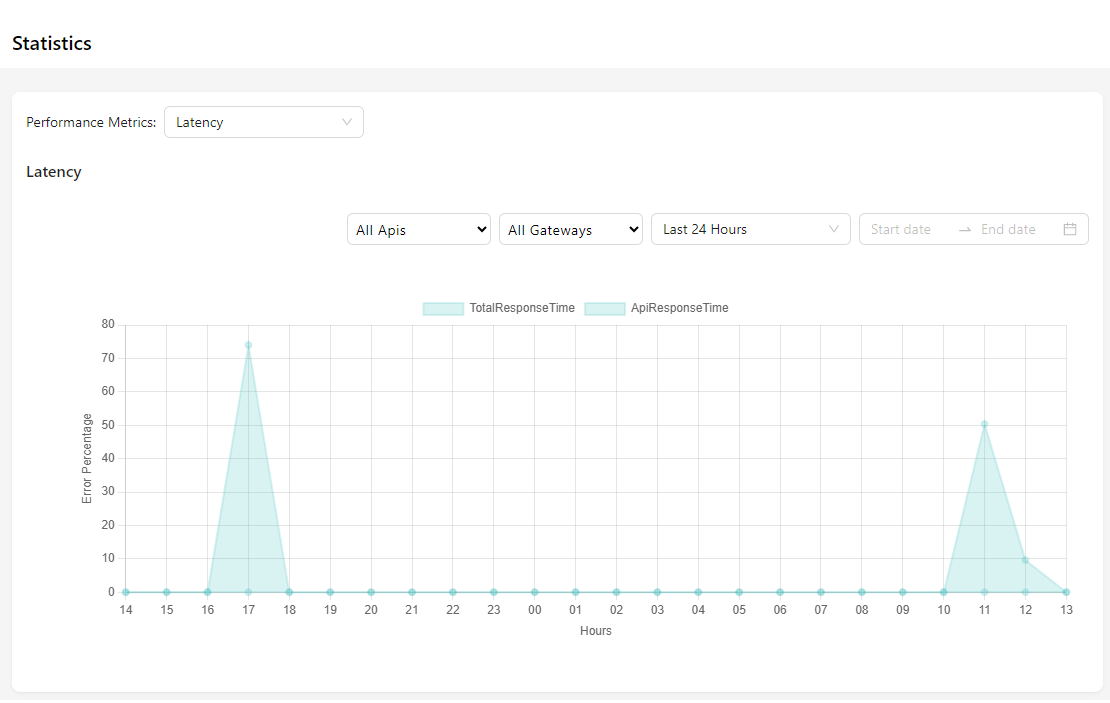
Latency
Latency is the time it takes for an API request to be processed and returned. It calculates the time between submitting a request and receiving a response.
-
Available time filters include:
- Last 24 Hours
- Last 7 Days
- Last 30 Days
- Last 12 Months
- Custom Filter: Users input a start and end date to view specific results.
-
API selection options include:
- Specific API
- All APIs
-
Gateway selection options include:
- Specific Gateway
- All Gateways
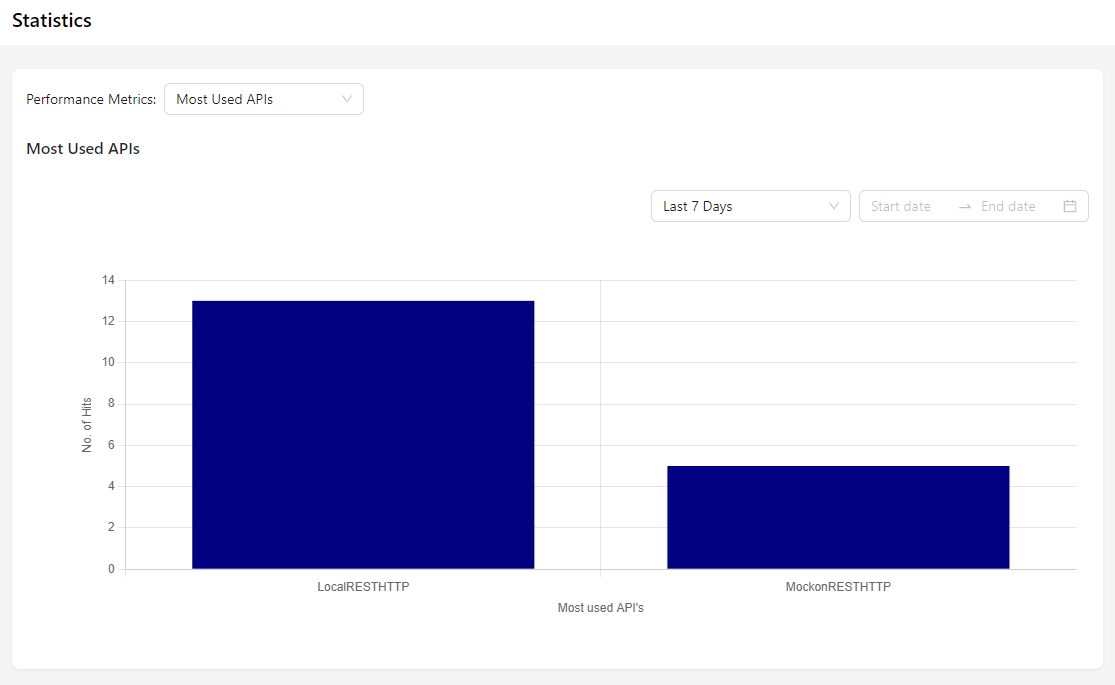
Most Used APIs
This section helps identify the most popular APIs per unit of time.
- Available time filters include:
- Last 7 Days
- Last 30 Days
- Last 12 Months
- Custom Filter: Users input a start and end date to view specific results.
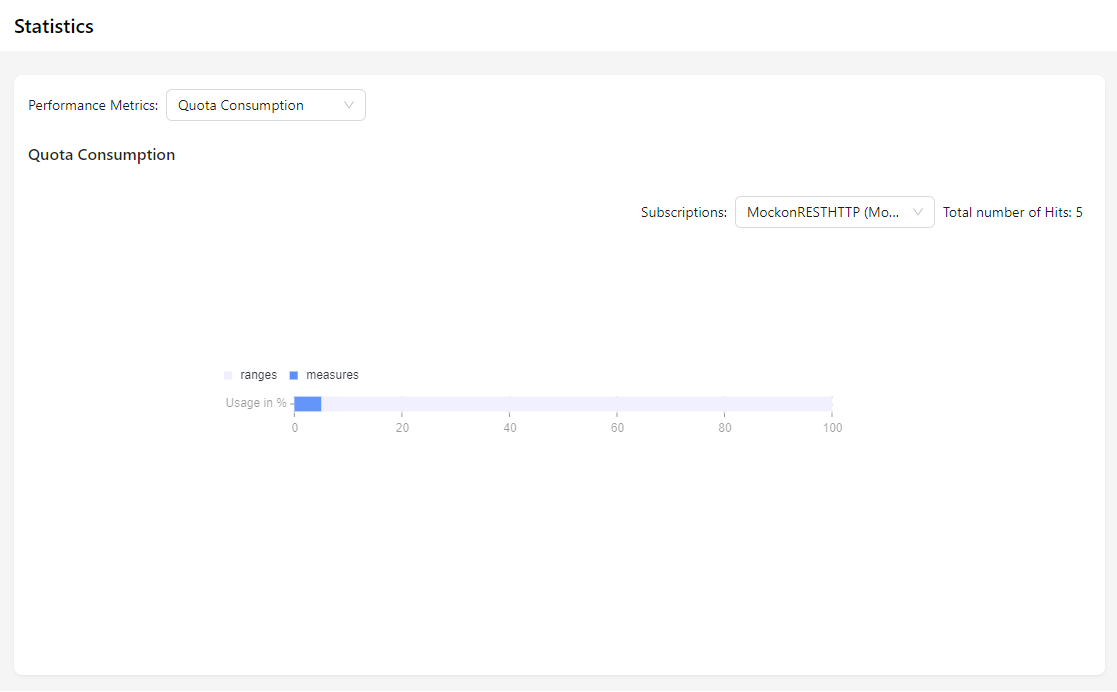
Quota Consumptions
This section helps track and manage API usage to stay within set limits.
Here, you can select the APIs to view the total number of hits.
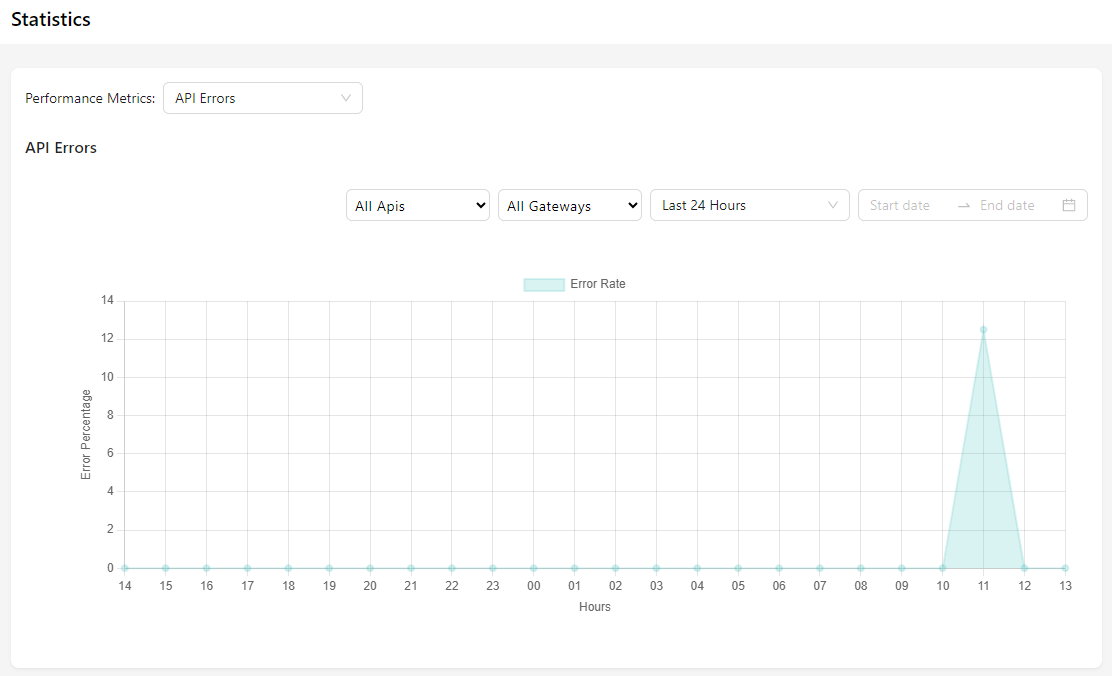
API Errors
This section helps identify the error or failure of APIs per unit of time.
-
Available time filters include:
- Last 24 Hours
- Last 7 Days
- Last 30 Days
- Last 12 Months
- Custom Filter: Users input a start and end date to view specific results.
-
API selection options include:
- Specific API
- All APIs
-
Gateway selection options include:
- Specific Gateway
- All Gateways
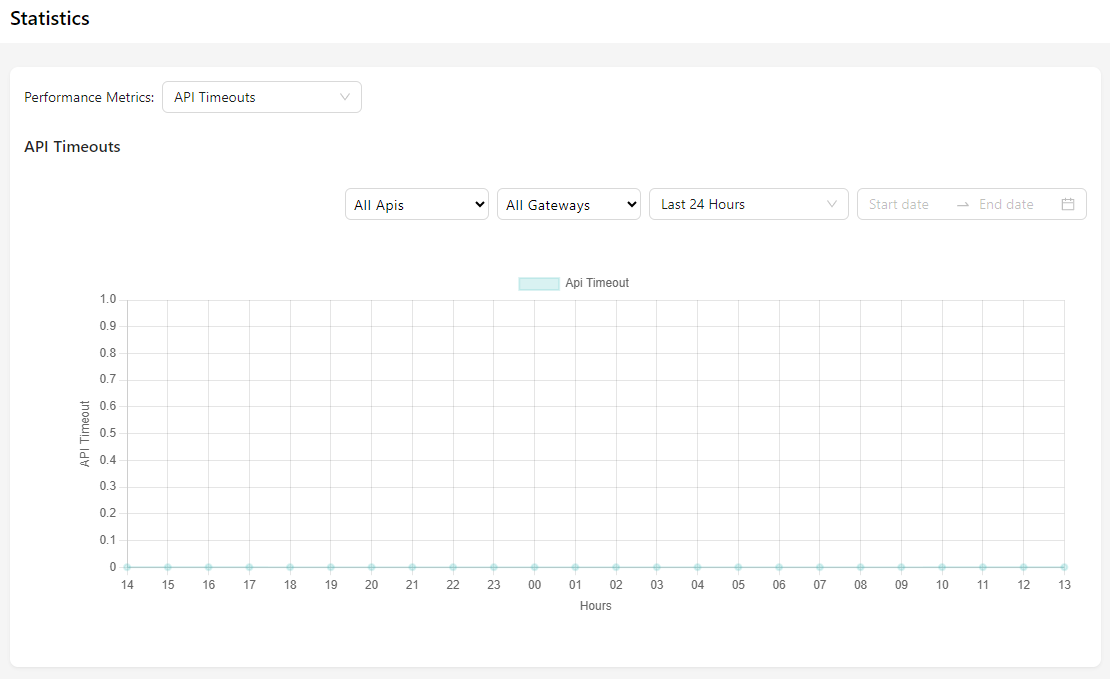
API Timeout
It shows how many times an API failed to respond within a given time.
-
Available time filters include:
- Last 24 Hours
- Last 7 Days
- Last 30 Days
- Last 12 Months
- Custom Filter: Users input a start and end date to view specific results.
-
API selection options include:
- Specific API
- All APIs
-
Gateway selection options include:
- Specific Gateway
- All Gateways